Recommended: Listen to the Podcast Episode that accompanies this analysis
Goal: To investigate the interactive effect of throwing hand and batting stance on hitting performance using Major League Baseball data from 1992-2015
Data source: http://www.baseball-reference.com/play-index/
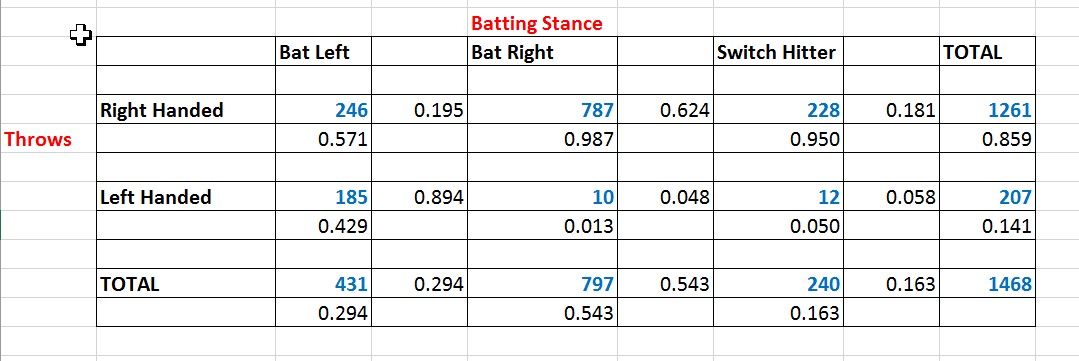
Descriptive Statistics:
(values in black are proportions)
Key takeaway:
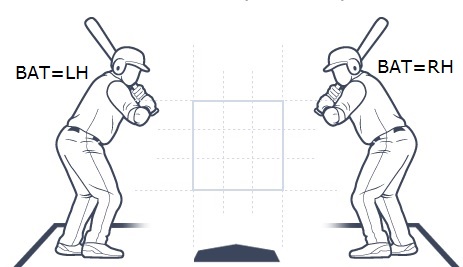
- The majority of players (62% of lefties and 89% of righties) hit with their non-dominant hand closest to the knob of the bat
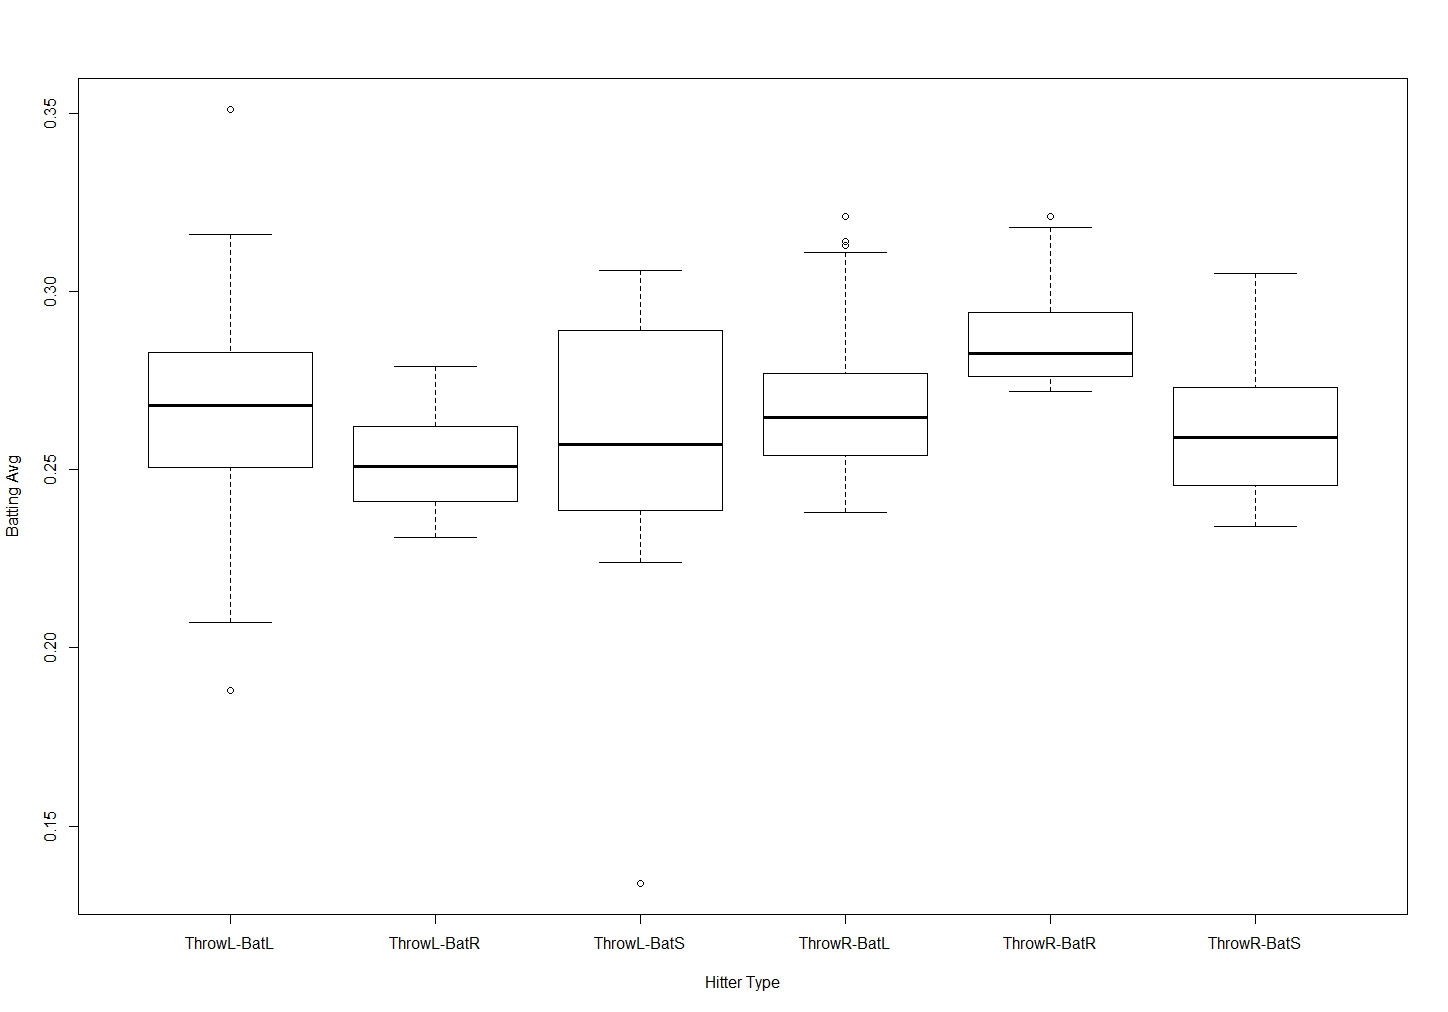
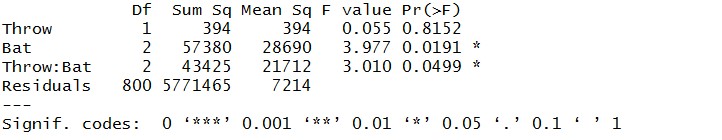
Batting Average:
(text in white shadow boxes is R code)
[shadowbox]>attach(BattingDataALL.new)
>boxplot (BA~Type, xlab=”Hitter Type”, ylab=”Batting Avg”)[/shadowbox]
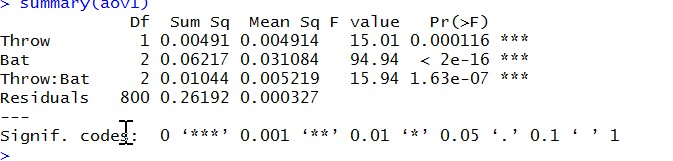
ANOVA
[shadowbox]>aov1<- aov(lm(BA~Throw*Bat))
>summary(aov1)[/shadowbox]
—
t-tests
Left-handed players
[shadowbox]
>lhanddat <- battingdataall[which(battingdataall$Throw=”=’L’),]
>t.test(BA ~ Bat, data=lhanddat)
[/shadowbox]
t = 2.9203, df = 11.385, p-value = 0.01348*
mean in group L mean in group R
0.2667065 0.2517000
Right-handed players
[shadowbox]
>rhanddat <- battingdataall[which(battingdataall$Throw=”=’R’),]
>t.test(BA ~ Bat, data=rhanddat)
[/shadowbox]
t = -13.435, df = 349.25, p-value < 2.2e-16***
mean in group L mean in group R
0.266295 0.285635
Key takeaway:
- Over this period, right-handed batters have a higher batting average than left-handed batters
- For both left-handed and right-hand batters, batting average is significant higher for batters that hit with their non-dominant hand closest to the knob of the bat
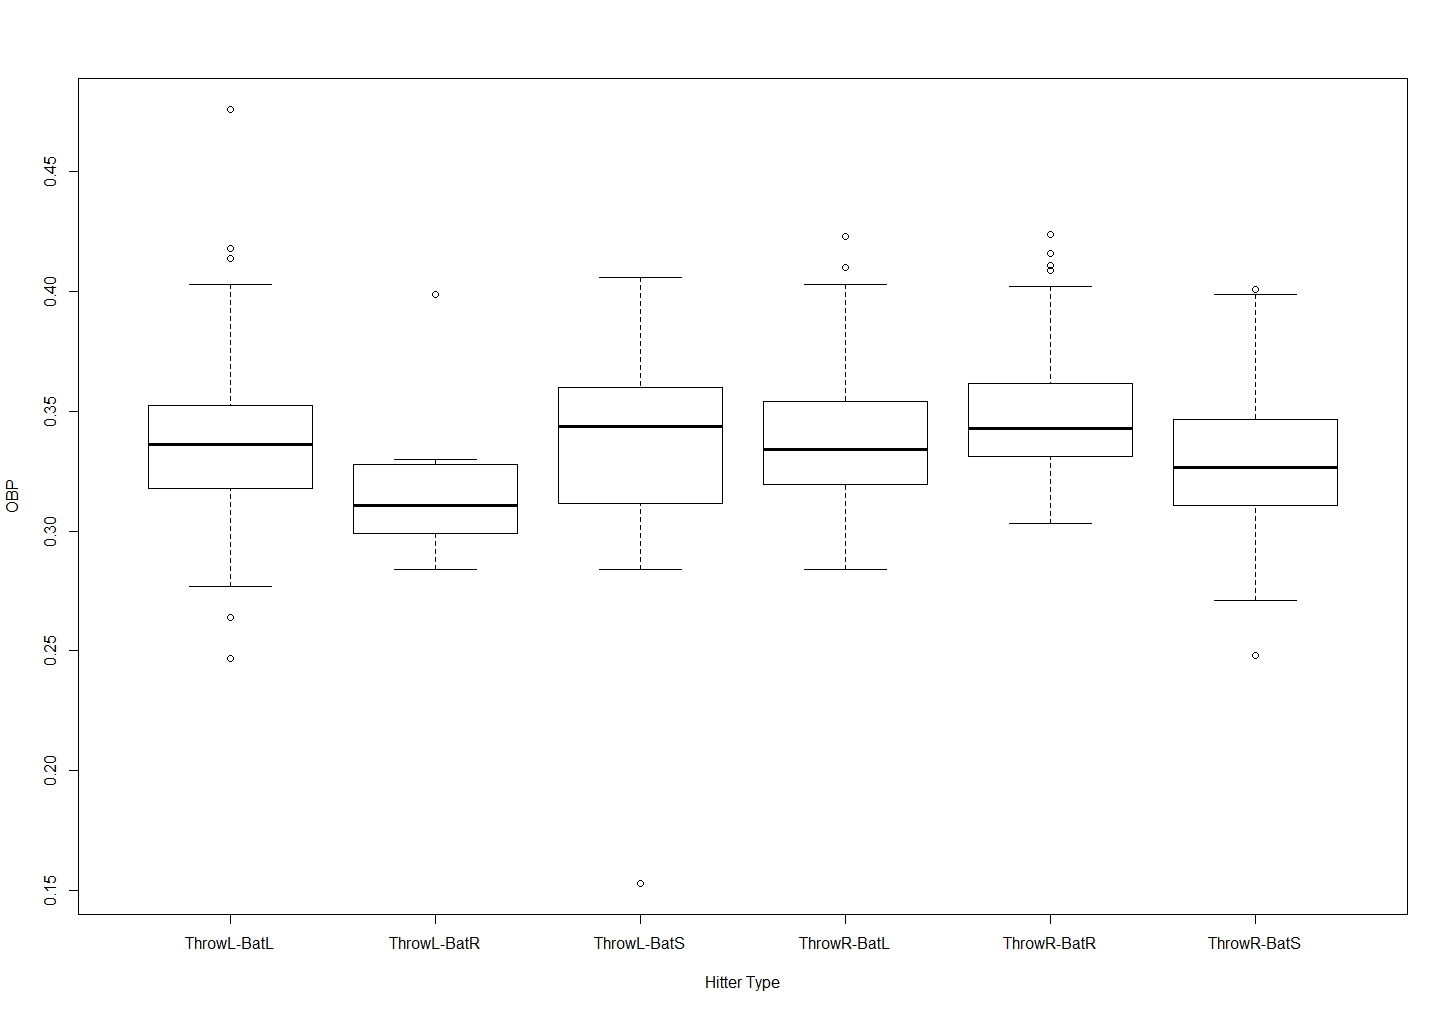
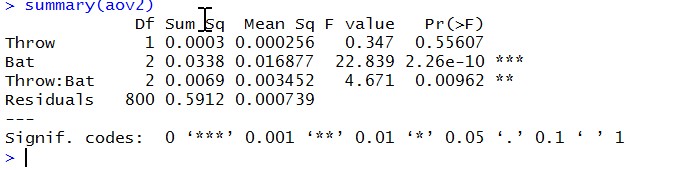
On Base Percentage (OBP)
[shadowbox]>boxplot (OBP~Type, xlab=”Hitter Type”, ylab=”OBP”)[/shadowbox]
ANOVA
[shadowbox]> aov2 <- aov(lm(OBP~Throw*Bat))
> summary(aov2)[/shadowbox]
t-tests
Left-handed:
t = 1.8323, df = 9.9128, p-value = 0.09708
mean in group L mean in group R
0.337413 0.318600
Right-handed:
t = -3.799, df = 397.12, p-value = 0.000168**
mean in group L mean in group R
0.337390 0.346675
Key takeaway:
- Over this period, right-handed batters have a higher OBP than left-handed batters
- There is no significant effect of batting side for left-hand dominant players
- For right-hand dominant players, OBP is higher for right-handed batters
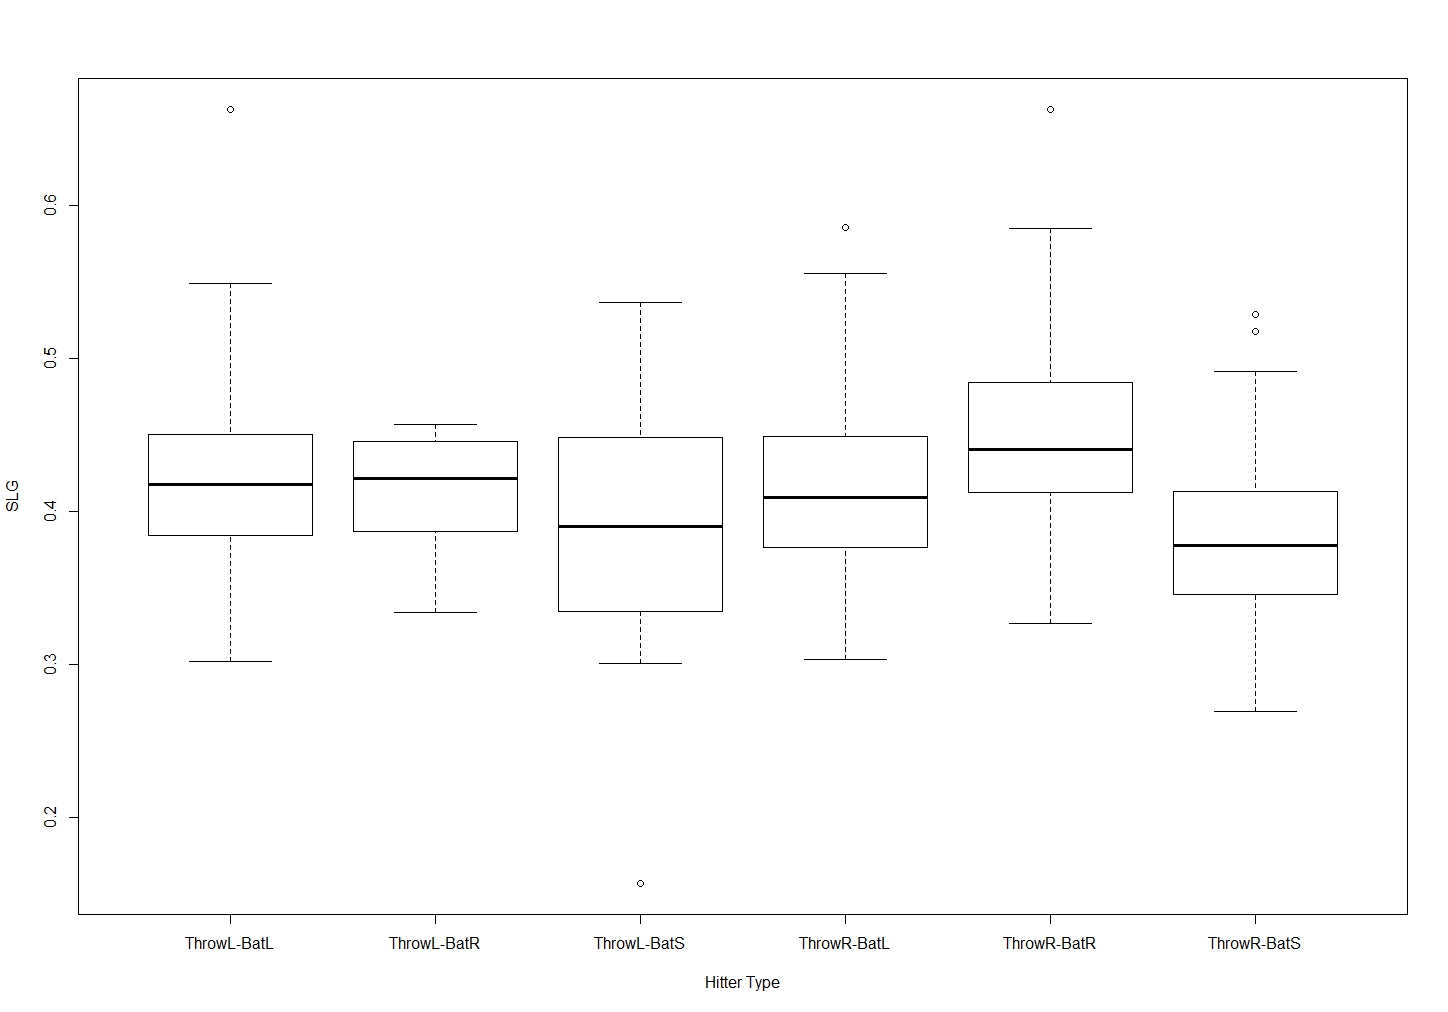
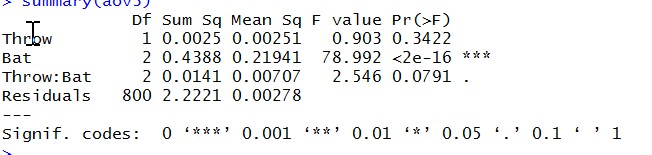
Slugging Percentage (SLG)
[shadowbox]>boxplot (SLG~Type, xlab=”Hitter Type”, ylab=”SLG”)[/shadowbox]
[shadowbox]> aov3 <- aov(lm(SLG~Throw*Bat))
> summary(aov3)[/shadowbox]
t-tests
Left-handed
t = 0.42752, df = 10.761, p-value = 0.6774
mean in group L mean in group R
0.4206413 0.4150000
Right-handed
t = -6.4881, df = 397.3, p-value = 2.59e-10***
mean in group L mean in group R
Key takeaway:
- Over this period, right-handed batters have a higher SLG than left-handed batters
- There is no significant effect of batting side for left-hand dominant players
- For right-hand dominant players, SLG is higher for right-handed batters
Stolen Bases (SB)
[shadowbox]> aov4 <- aov(lm(SB~Throw*Bat))
> summary(aov4)[/shadowbox]
Key takeaway:
- Surprisingly, the number of stolen bases also seems to be related to the batting stance and hand dominance