Recommended: Listen to the Podcast Episode that accompanies this analysis
Goal: To determine whether there is a decline in batting performance after a “choking” event in baseball relative to pre-event performance. Also, to determine which factors influence this effect.
Data sources:
http://www.baseball-reference.com/play-index
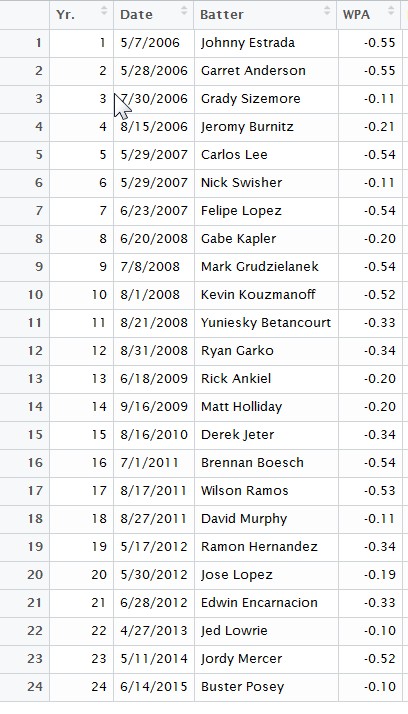
Event definition: 9th inning, 1 out, leverage index >= 1.5, batter hits into double play to end the game, sampling period 2006-2016
Sample:
Analyses:
1) Comparison of slugging percentage before and after event – no significant difference
[shadowbox]t.test(SLGB, SLGA, mu=0, paired=T)
data: SLGB and SLGA
t = 0.52132, df = 23, p-value = 0.6071
alternative hypothesis: true difference in means is not equal to 0
95 percent confidence interval:
-0.1113049 0.1863049[/shadowbox]
2) Multiple Regression Analysis:
-Dependent variable – Difference between SLG before and after event (SLGB – SLGA)
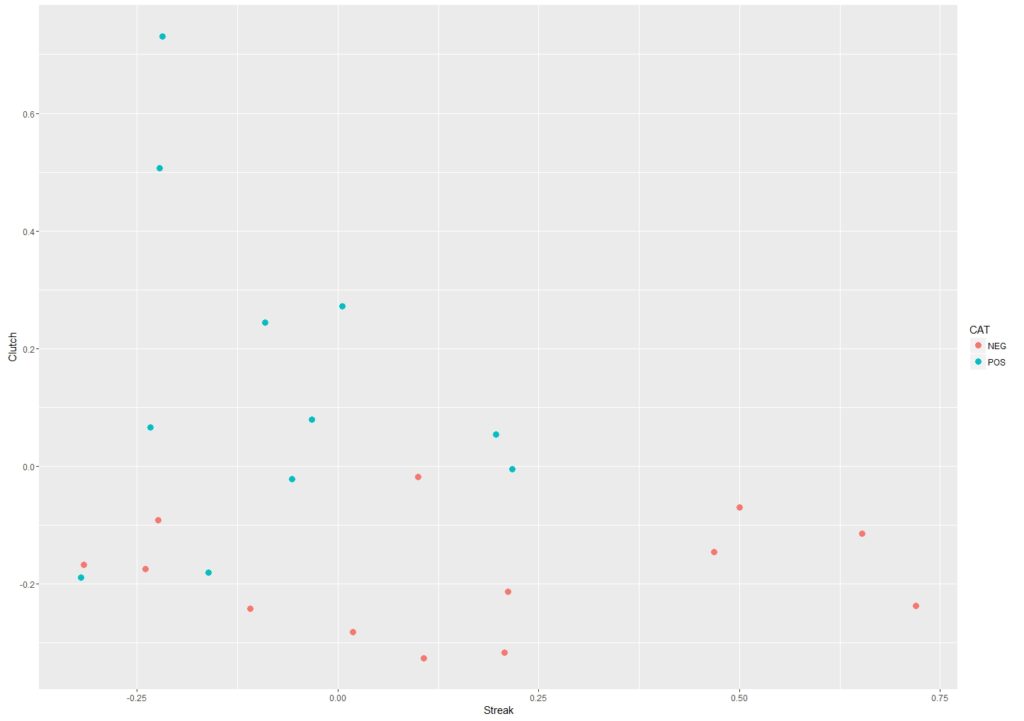
-Independent variables – Win Percentage Added, Game Importance (determined from month and standings), Streak (difference between SLGB and career SLG), and Clutch (difference between SLG career innings 1-8 and SLG career inning 9)
[shadowbox]
Call:
lm(formula = Diff ~ Import + WPA + Streak + Clutch)
Residuals:
Min 1Q Median 3Q Max
-0.45681 -0.15405 -0.03194 0.12978 0.80784
Coefficients:
Estimate Std. Error t value Pr(>|t|)
(Intercept) -0.1089586 0.1223656 -0.890 0.3844
Import -0.0004232 0.0077083 -0.055 0.9568
WPA -0.3499255 0.3285009 -1.065 0.3001
Streak -0.5762721 0.2030772 -2.838 0.0105 *
Clutch 0.5266565 0.2501067 2.106 0.0488 *
—
Signif. codes: 0 ‘***’ 0.001 ‘**’ 0.01 ‘*’ 0.05 ‘.’ 0.1 ‘ ’ 1
Residual standard error: 0.275 on 19 degrees of freedom
Multiple R-squared: 0.4968, Adjusted R-squared: 0.3909
F-statistic: 4.69 on 4 and 19 DF, p-value: 0.008388
[/shadowbox]
The following plot shows batters that had SLGB>SLGA as Negative and SLGB