[shadowbox]
Visual Information about Horizontal Pitch Movement: Sensitivity, Release Points & Eye Separation
Following up on my post on pitch tunneling which examined pitch movement in the vertical plane, I want to now consider visual information available to a batter about the trajectory of pitch in the horizontal plane (e.g., whether it will cross on the inside or outside edge of plate). Again the goal here is to talk only in terms of quantities that are available perceptually to the batter. As I discuss in detail here, because our eyes are separated horizontally on our head there are actually two classes of information available: Monocular information about pitch trajectory is available from either eye’s image alone while Binocular information requires combining the two eye images.
Monocular Information about Horizontal Trajectory
Figure 1 below illustrates a ball travelling along the path shown by the sold arrow that will pass some lateral distance (Xp) from the batter’s eye (large circle).
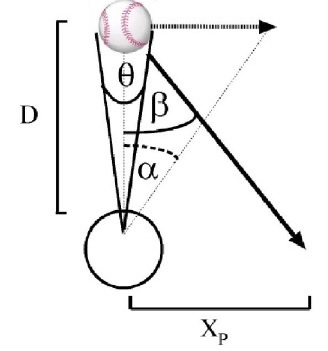
Figure 1
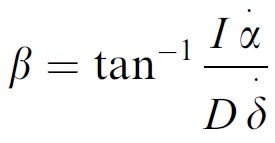
In such cases, the motion can be decomposed into the frontoparallel (shown the dashed line with arrow) and depth components. The angular direction of the pitch (β) is given by:
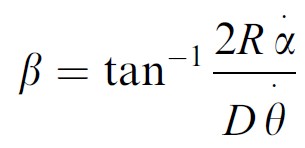
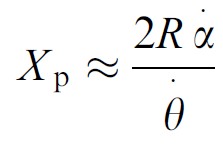
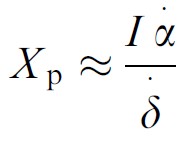
where R is the ball’s radius, D is the ball’s distance from the eye, θ-dot is the rate of expansion of the ball’s retinal image and α-dot is the angular lateral speed of the ball. The horizontal distance of the ball when it passes the hitter’s eye (Xp) is given by:
Binocular Information about Horizontal Trajectory
Figure 2 below illustrates the same situation but now considered with the additional information available by combining the two eyes’ (large circles) images:
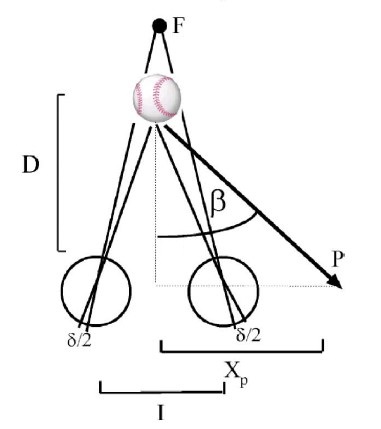
Figure 2
In this figure, F is some fixed reference point (e.g., the pitcher’s mound) and I is the distance between the batter’s eyes (measured from the left pupil center to the right pupil center). In this figure it can be seen that there is a difference between the two eyes’ images of the ball, called a binocular disparity. Relative to the retinal images of point F (shown with solid lines), the image of the ball is offset to the right in the right eye and to the left in the left eye. This creates a binocular disparity equal to the sum of angular offsets in the two eyes, δ . In this situation, the angular direction of the pitch (β) is given by:
where I is the interpupillary separation, D is the distance of the ball, δ-dot is the rate of change on binocular disparity and α-dot is the angular lateral speed of the ball (as shown in Figure 1). The horizontal distance of the ball when it passes the hitter’s eye (Xp) is given by:
Sensitivity to Information About Horizontal Trajectory
When both binocular and monocular sources of information about trajectory are available, our ability to discriminate differences in the angle β varies as function of how far the object is passing from the eyes. The top panel in Figure 3 below shows discrimination thresholds (i.e. the smallest difference in β that can be reliably detected). Note that the y-axis is inverted so higher values mean better performance.
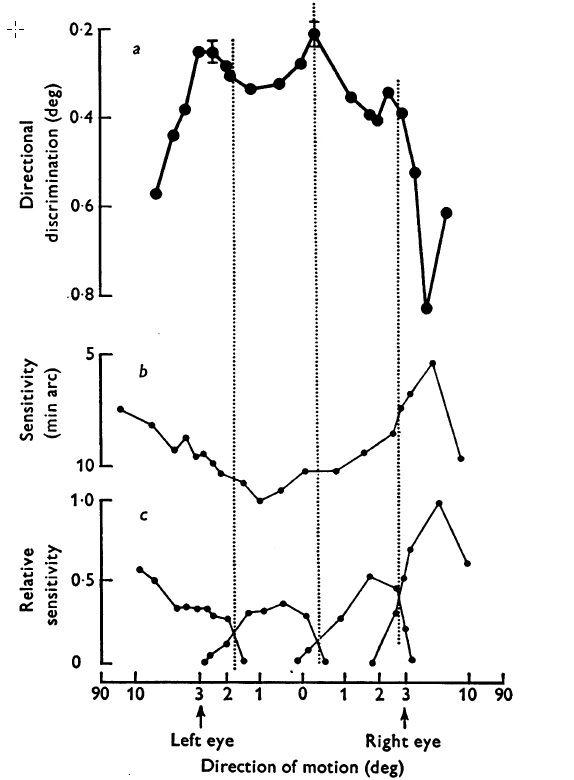
Figure 3 – Data from Beverley & Regan (1975)
A couple points to note from this data. First, in terms of direction discrimination in the top panel, there are 3 local minima where performance is best: when the trajectory β corresponds to an object that will collide roughly with the left eye, nose, and right eye respectively. For trajectories that will miss the head (>5 deg β angle), discrimination performance falls off rapidly with thresholds reaching nearly 1 deg. For reference, 1 deg of visual angle is roughly equivalent to the size of 4 baseballs in this situation (so very poor performance, indeed!). Second, the other two panels in the figure actually provide an explanation for why we get these local minima. The middle panel shows the sensitivity to motion in depth, that is the rate of change of disparity (see Figure 2 above) needed so that the observer can just detect the object is moving towards them. Note the y-axis here — it is in arc min not deg! Our ability to detect something is coming at us is very good. The bottom panel shows the ratio of discrimination and sensitivity thresholds. What can be seen are what looks like 4 distinct curves. This has been taken as evidence (supported by other studies) that we have 4 populations of neurons in our brains which respond to objects moving in depth and it is their combined output which determines are ability to judge direction.
What does this all mean for baseball batting?
Effect of horizontal release point and batting stance
Let’s now look at the range of β angles that are involved in baseball. This will depend on 3 basic factors: the horizontal release point of the pitch, whether the batter is same-sided (e.g., RH pitcher RH batter) or opposite sided, and where the batter stands in the batter’s box. For the latter, based on previous estimates , I assumed the batter’s eyes were roughly 2.8 feet horizontally from the plate and were aligned with it’s back edge. A pitcher can produce a large value for horizontal release point by moving to one end of the pitching rubber and/or dropping down to throw sidearm as shown in the example of BJ Ryan and the gifs below.

The estimated β angles for different release points ranging from 1-4 feet are shown in Figure 4 below.
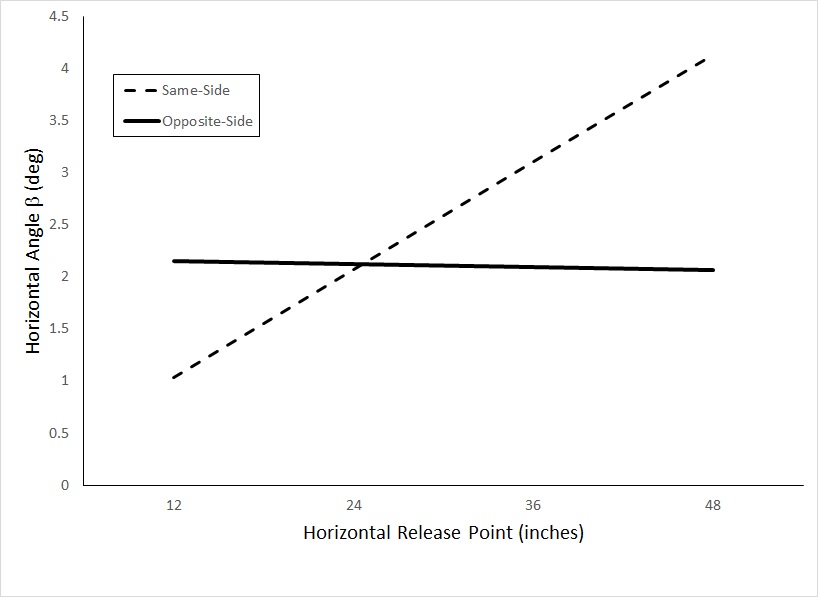
Figure 4 – β angles as a function of batting side and release point
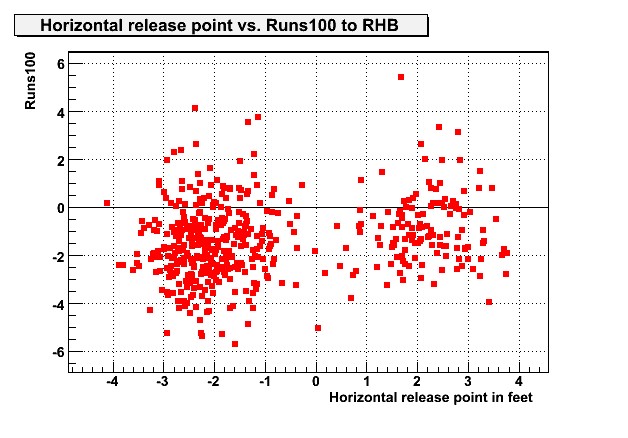
It is clear from this figure that for an opposite-sided pitcher horizontal release point has barely any effect at all on horizontal angle and the average value of β (about 2.2 deg) is right at one of the local minima (shown in Figure 3) where we are most sensitive to trajectory. Not surprisingly the story is a bit different for same-side pitchers as the angle β does vary much more dramatically with release point. However, the range (roughly 1-4.5 deg ) is still fairly close to the local mimina. Therefore, discrimination performance should be relatively good even for the most extreme horizontal release points. Consistent with this idea, although it has been frequently proposed that extreme horizontal release points give same-sided batters trouble, there does not actually seem to be any significant relationship between release point and batting performance as shown in the analysis from Hardball Times below. Note, I have not shown it here but the figure is essentially the same for left handed batters.
Effect of separation between the eyes
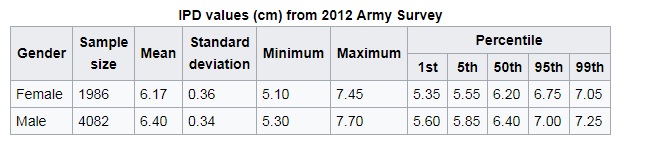
One of the more interesting (and perhaps surprising) things that comes from looking at visual information about horizontal pitch trajectory is the importance of IPD (called I in the figures and equations above), the interpupillary distance.
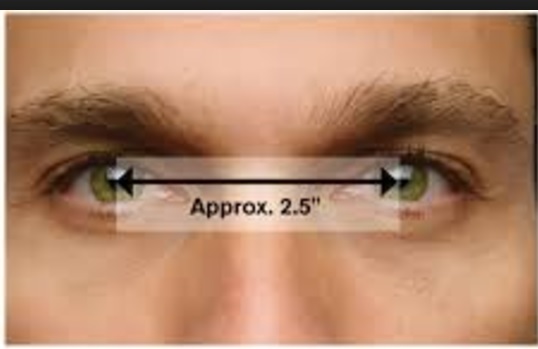
Individual differences in IPD can be quite large with values ranging from just around 2-3″.
Having a large value of IPD is potentially advantageous for two reasons. First, as can be seen in the equations above, the larger the value of IPD, the larger the change will be in the binocular disparity of an approaching ball making it easier to detect and discriminate it’s trajectory. Furthermore, it has also been shown that people with below average IPD’s tend to have sub-optimal convergence and accomodation making it difficult to keep objects clearly in focus. But does this matter for batting?
Recently, Hunfalvay & Murray (2017) measured the value of IPD for 20 batters and pitchers with MLB experience. Although the small number of participants brings into the question the reliability of the correlations, there was a significant relationship between hitting performance and IPD as shown in the figure below:
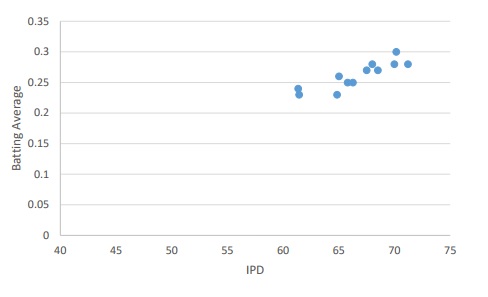
For batters, the correlations between IPD and batting average, OBP and OPS were .89, .71 and .69 respectively all of which were statistically significant. Not surprisingly there was no significant relationship between IPD and pitching stats. The authors suggest that IPD should be added as a measure for screening players and those with small IPD’s should be encouraged to engage in accomodation and covergence training to offset potential disadvantages.
Summary & Future Work
-Analysis of the visual information available for judging horizontal pitch trajectory suggests there will be little benefit to a pitcher trying to deliberately increase their horizontal release point (however, this may have other effects not discussed here such as making it more difficult to follow the ball with eye movements).
-The difference in information about horizontal trajectory could potentially explain platoon advantages (i.e., differences in batting performance for same and opposite sided batters) but the effect is quite small.
-Having a below average interpupillary distance may give a batter a disadvantage that could potentially be offset through training although research is needed to determine if this type of training actually transfers to baseball. Another possibility is that batters with a small IPD rely more on monocular information about trajectory which can also be improved through training.
-In a future post, I am going to build on this analysis by looking at the horizontal movement of different pitch types asking questions such as: is horizontal pitch tunneling possible? When do different pitches types become distinguishable based on horizontal movement? For example, Chris Sale’s slider and fastball, which start on the same trajectory but end up in very different horizontal locations!
Chris Sale’s slider + fastball overlaid. Exact same motion. Exact same arm slot. Unfairly different result pic.twitter.com/Tnl7ztW71l
— Ozzie (@OldComiskey) July 1, 2017
[/shadowbox]